 EnaGuard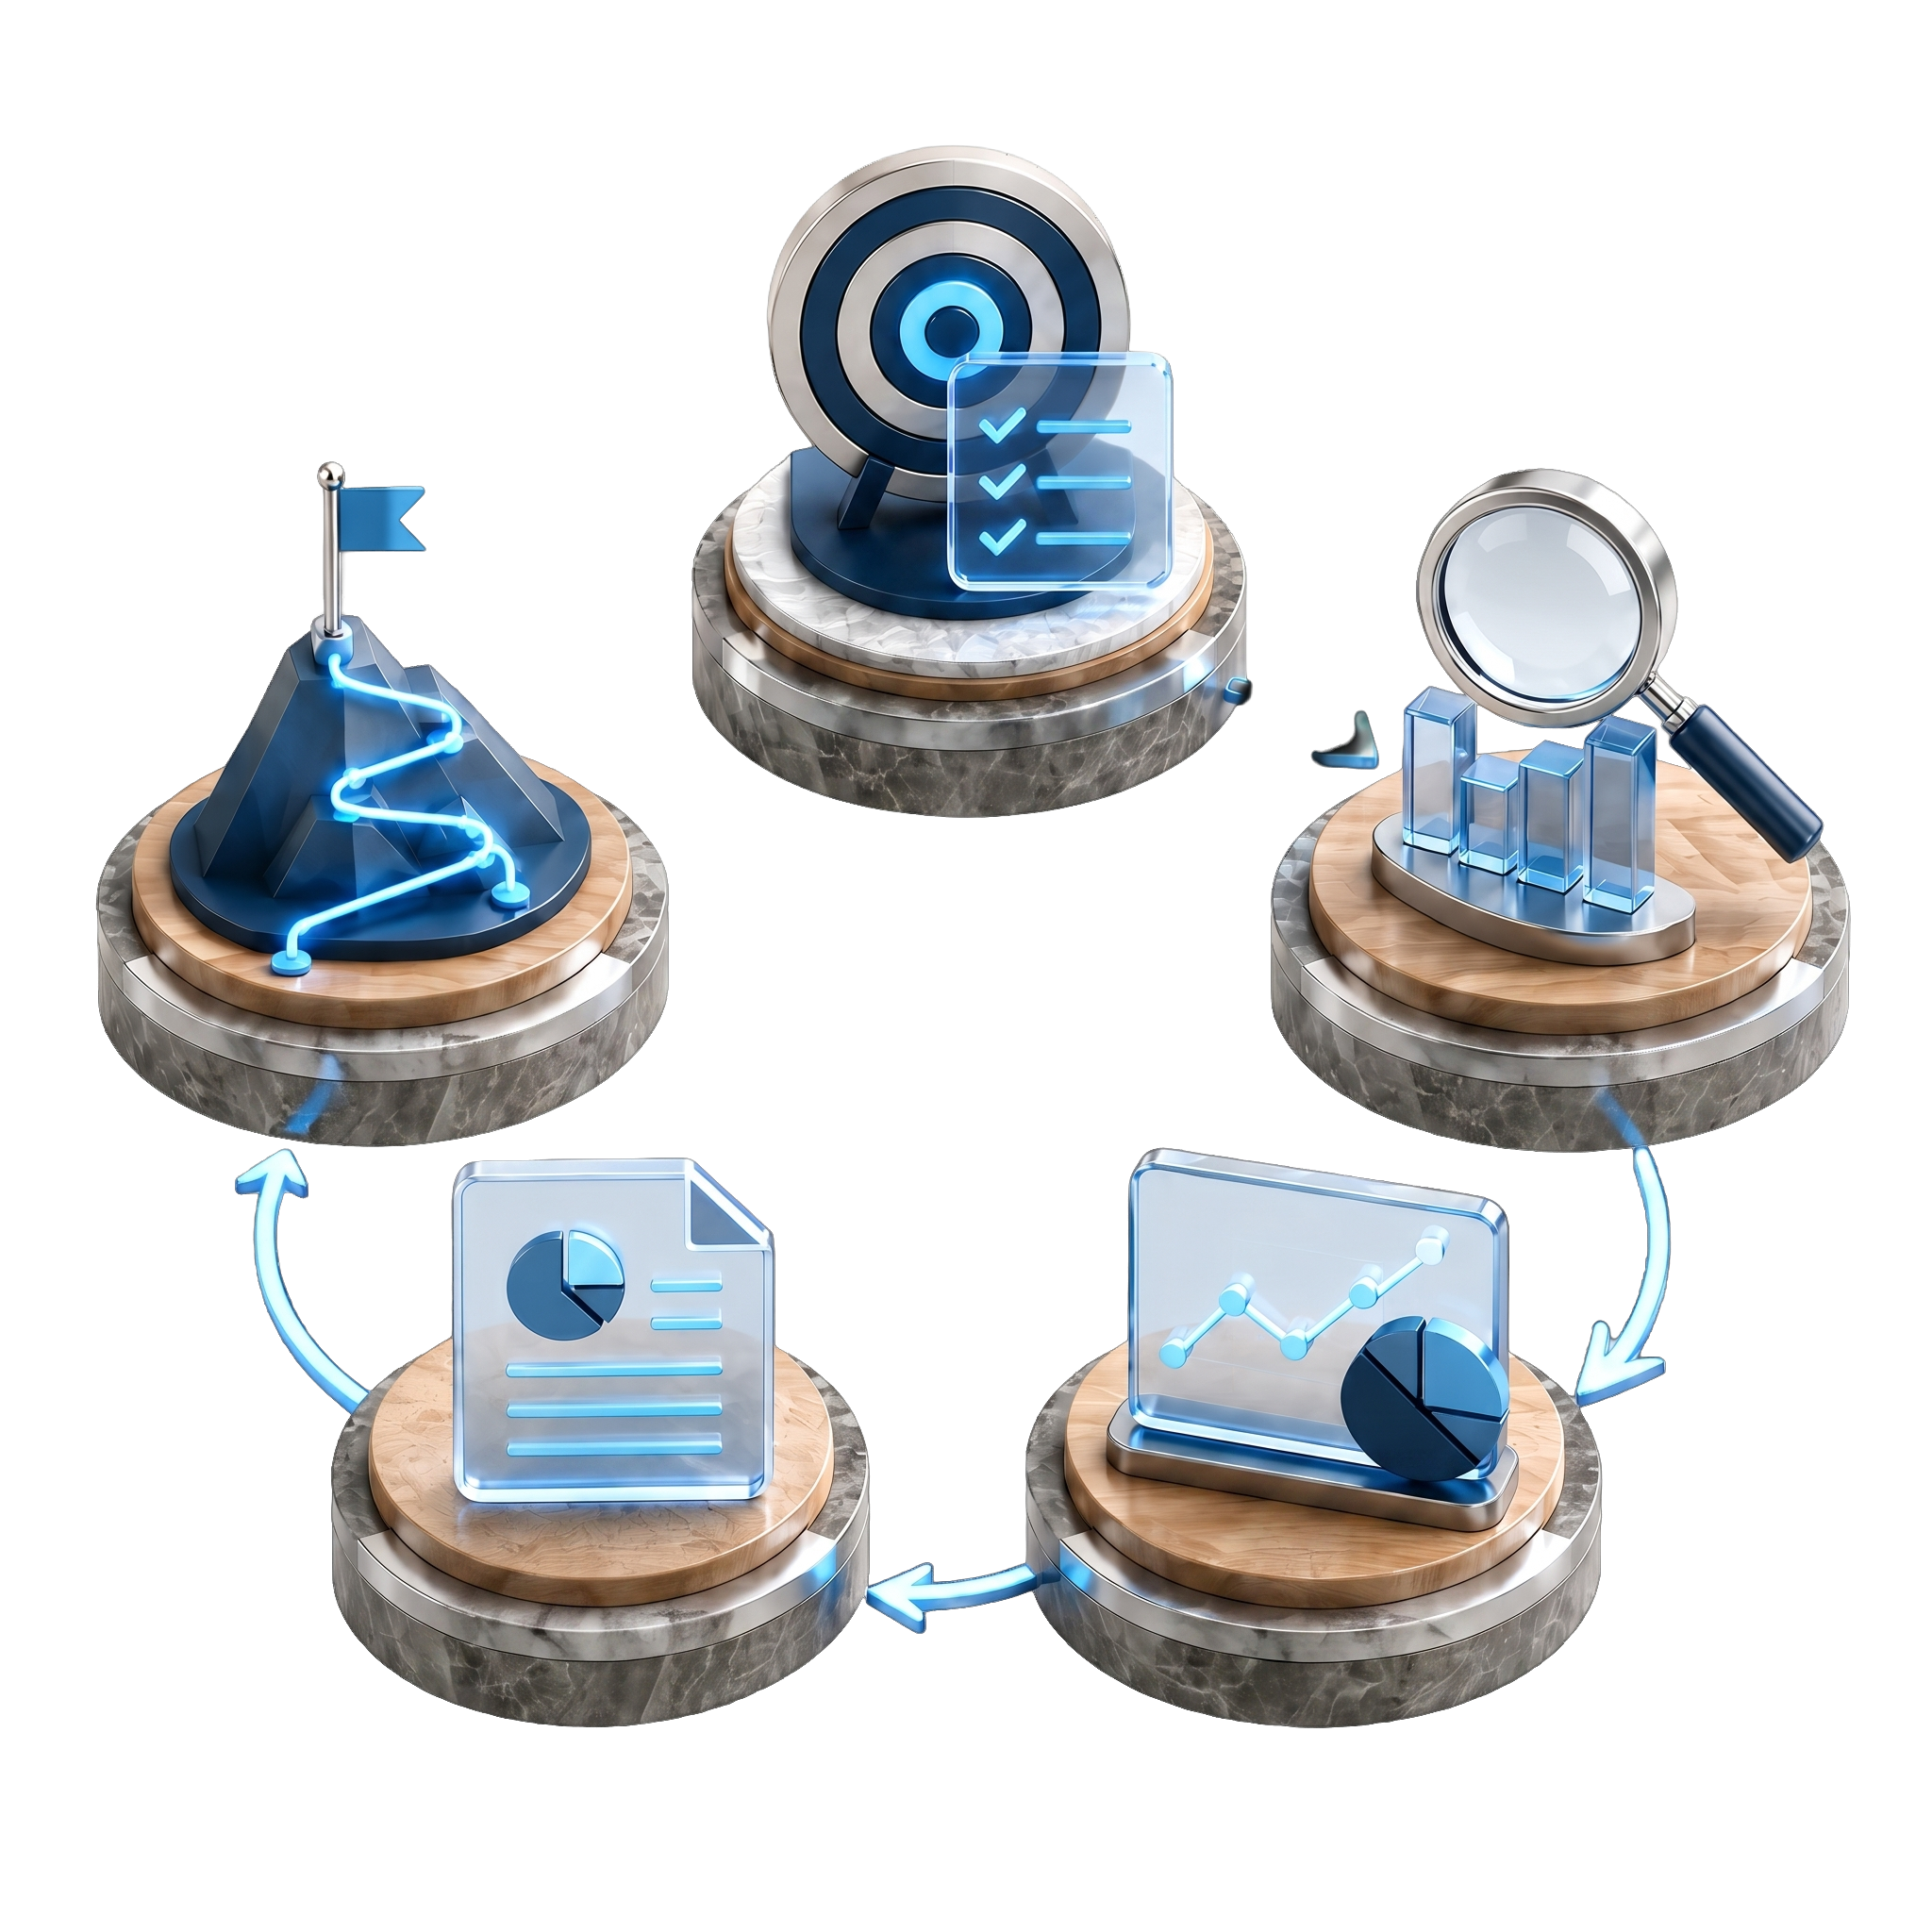
One process, three evidence depths: Signal, Focus, Verify
EnaGuard turns AI governance and AI architecture claims into evidence that can be reviewed. Signal, Focus, and Verify use the same assessment backbone at different depths, from fast evidence triage to board-ready verification language.
Paid work starts only when the product layer, evidence access, and claim boundary are clear.
The first conversation is a readiness gate. It confirms whether Signal, Focus, or Verify is appropriate, which operating model can be supported, who owns the required evidence, and whether the workbook, methodology, assessor capacity, and QA discipline are ready for the engagement.
The assessment process covers all three EnaGuard products, but not with the same claim
Each product layer answers the same governance question with a different level of evidence: what can leadership safely say about this AI architecture, and what still needs work?
EnaGuard Signal
Fast evidence triage for early executive awareness. It surfaces weak claims, red flags, and priority questions before the organization commits to a deeper review.
EnaGuard Focus
Targeted review for a defined system, risk theme, regulation, or architecture axis. It clarifies control gaps, evidence owners, and the roadmap for a specific decision.
EnaGuard Verify
Deeper verification for an enterprise-level architecture claim. It adds broader sampling, challenge, QA discipline, and explicit boundaries around what the report can support.
For the full product distinction, see Product Layers.
The process moves from scope to evidence, then from evidence to accountable decisions
Scope & Claim Boundary
The deployment model, industry, AI use case, product layer, and the report claim are clarified before evidence collection begins.
Evidence Owner Map
Business, technology, risk, security, compliance, and data owners are mapped so declarations can be checked against real records.
Evidence Gathering
Documents, architecture records, live configurations, logs, tests, metrics, incidents, and interviews are collected according to scope.
Analysis & Challenge
Evidence is reviewed across the architecture axes; weak, missing, or contradictory proof is separated from well-supported claims.
Report & Roadmap
Findings become a current-state profile, a verification view where the selected product layer supports it, and a prioritized roadmap whose first action horizon is 90 days.
Signal, Focus, and Verify change the depth of the evidence, not the discipline of the process
| Layer | Typical Scope | Evidence Depth | Report Language | Best Use |
|---|---|---|---|---|
| Signal | Broad early view or executive triage. | Existing documents, interviews, selected records, and visible red flags. | Evidence triage, priority questions, and directional risk view. | Early governance awareness and investment prioritization. |
| Focus | Defined system, regulation, risk theme, or architecture axis. | Targeted samples, evidence owner interviews, configuration, test, and control records. | Findings, control gaps, evidence confidence, and focused roadmap. | Critical system review, remediation planning, or transformation decision. |
| Verify | Enterprise architecture claim or external stakeholder requirement. | Broader evidence catalog, challenge, revalidation, and QA review. | Verification view, claim boundary, residual risk, and board-ready package. | Board reporting, regulator dialogue, enterprise evidence position. |
Where does evidence come from? Twelve source families
In AI governance, evidence is not only policy. EnaGuard reads the traces that show how an AI system is actually designed, operated, monitored, tested, and corrected.
Shows how the system is defined
- 01Policy and procedureRules, roles, approval paths, and operating responsibilities.
- 02Architecture and design recordDiagrams, data flows, model boundaries, and control points.
- 03Inventory and scope recordSystems, use cases, business units, and scope boundaries.
- 04Contract and external verificationVendor commitments, third-party controls, and external confirmations.
Shows how the system actually runs
- 05Live configurationActual environment settings, access, integrations, and guardrails.
- 06Code and version recordChange history, release notes, branches, and deployment traces.
- 07Log, trace, and access recordWho interacted with what, when, through which system, and how.
- 08Production metrics and dashboardsPerformance, error, usage, cost, latency, and quality indicators.
Shows how the system behaves under pressure
- 09Test and validation resultLoad, failure, security, accuracy, and misuse scenarios.
- 10Incident and response recordAI-related incidents, escalation, rollback, and corrective action traces.
- 11Interview and attestationEvidence owner explanation; not sufficient alone, read with other traces.
- 12Periodic control and revalidationRecords showing controls are retested over time.
This catalog only shows source families where evidence may come from. Which evidence is assessed against which architecture axis, with what weight and threshold, is specific to the engagement and is not published.
Strong AI governance becomes visible when three questions can be answered with evidence
Is the AI architecture intentionally designed?
Architecture diagrams, model boundaries, data flows, control points, and deployment assumptions are compared against the operating reality.
Can the organization control change?
Versioning, testing, access, release approvals, fallback paths, and monitoring records show whether change is governed rather than improvised.
Can leadership defend the claim?
The final language states what the evidence supports, where confidence is limited, and which decisions still require remediation.
Six outputs, one evidence base
Current-State Profile
An evidence-based snapshot across six axes.
Verification View
Summarizes maturity, evidence confidence, scope coverage, residual risk, QA outcome, and claim boundaries without reducing the result to a single score.
Risk & Control Gaps
A clear list of areas not backed by evidence.
Industry Alignment
Current state compared against what's expected for your deployment-model segment.
Roadmap
A prioritized, actionable plan.
Benchmark Position On the roadmap
Anonymized comparison within your industry.
Timing changes with the evidence depth and claim level
Exact timing is confirmed in the written scope and depends on evidence access, population size, and complexity. The first 90 days describes the roadmap's initial action horizon, not a promise that every assessment finishes within 90 days.
Scope, evidence triage, management view, and 90-day priorities
Defined scope, sampling, targeted testing, findings, and roadmap
Population, sampling, challenge, independent QA, and board package
Let's choose the right assessment depth before starting
Discovery clarifies whether your immediate need is Signal, Focus, or Verify, and which evidence owners should be involved first.